We use cookies to improve functionality and personalize your content. To ensure compliance with the latest e-Privacy directive, we kindly ask for your consent to set these cookies. Learn more.
IV's Approach to TMI Data
Trace metallic impurities (TMI) information is listed in Section 5.0 on the Certificates of Analysis (CoAs) for all single-element stock Certified Reference Materials (CRMs) supplied by Inorganic Ventures. This information is critical for analysts performing trace metals testing to ensure they’re able to accurately quantify impurities, achieve necessary detection limits, minimize contamination, and avoid bias in their results.
At IV, we know how critical the TMI content can be for an ICP analysis, so we go the extra mile to ensure we report accurate impurity results that analysts can rely on. TMI in our products is determined not just by one analysis, but by two separate methods, using two separate instruments, and reviewed by two separate chemists!
Method #1: ICP-OES
The sample is analyzed at a high concentration. We routinely run 50,000 µg/mL solutions of the single-element CRM so that we can see as low concentrations of impurities by minimizing the dilution factor. The sample, along with a high purity acid blank, is analyzed against a calibration curve containing 0, 0.1, and 1.0 ppm standards containing all trace metals we analyze for (70 elements in total, see Figure 1). We use high purity reagents (acids and deionized water) along with bottles & pipet tips that have been specially treated via heated acid leaching followed by multiple rinses with 18 MΩ deionized water to eliminate contamination during sample preparation.
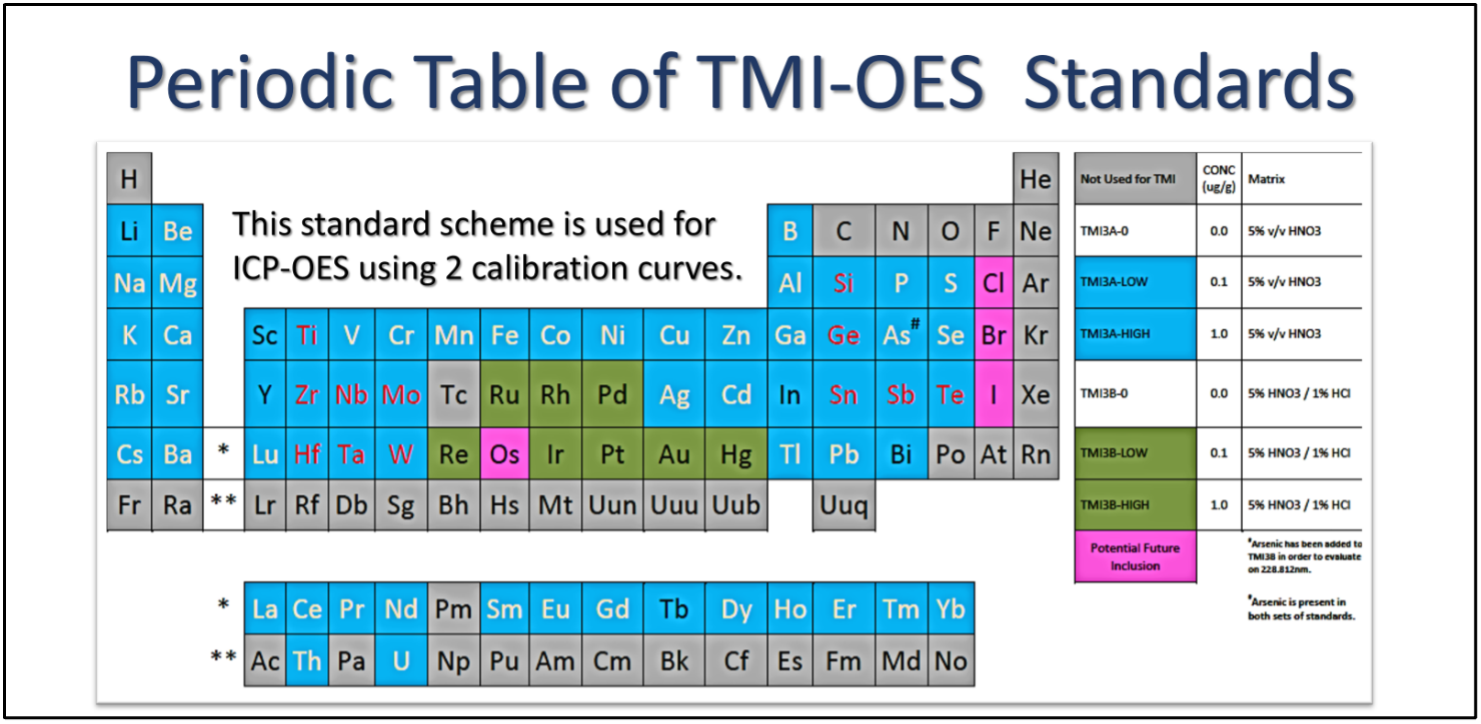
Figure 1. Calibration standards used to analyze TMI via ICP-OES.
IV’s chemists review the spectra directly for each element to determine whether there is a peak present for that impurity. We always check multiple wavelengths when available to ensure that the peak we are seeing is actually the impurity and not an interference. If there is no impurity/peak present for an element then we report the detection limit for the best wavelength for that element as 2 times the peak-to-peak noise. We multiply by 2 because we prefer to report a more conservative detection limit due to the variability of signal “noise” when no impurity appears to be present. Figure 2 shows an example of how we would calculate the detection limit.

Figure 2. Example of how detection limit (DL) is calculated based on the peak-to-peak noise from the spectra.
Need help determining potential interferences for your ICP-OES method? Check out our in-house Interference Table available for download through our virtual learning resource, IV Ignite!
Method #2: ICP-MS
IV takes a very different approach for TMI analysis via ICP-MS. We first dilute the sample to 100 ppm of the expected and certified element. Next we weigh out half of the 100 ppm diluted sample and spike it with a known concentration of all trace elements we analyze. We perform two separate dilutions, one in a 1% HNO3 matrix and one in a 1% HCl matrix. Each dilution is spiked with a unique standard containing a different group of elements for optimal stability and interferences minimization. See Figure 3 for the elements included in each unique spike standard.

Figure 3. Spike solution compositions for the ICP-MS method for determining TMI.
Analyzing all possible impurities via ICP-MS can be difficult to even set up an analysis scheme. First we run three blanks, followed by the diluted sample alone, then the diluted sample that includes the known spike, and finally three more blanks. As with the ICP-OES method, we only use high purity acid, 18 MΩ deionized water, and bottles and pipet tips that have been specially prepared. IV analysts carefully select the optimal gas modes and masses to use for each element to avoid interferences from other components in the sample. The impurity concentration in the sample is calculated based on the difference in intensity from the unspiked sample and the sample with a known amount of spike added. Intensities are also blank corrected based on the averages of the blanks run during analysis. Detection limits are calculated as 3 times the standard deviation of the blanks when no impurity is present. See Figure 4 for an example calculation for this method.

Figure 4. Example calculation for the detection limits and detected value for a magnesium (Mg) impurity using our ICP-MS TMI analysis method.
Putting It All Together
Our chemists review and compare results from both instruments/methods to ensure that any found impurity values match. If there are any discrepancies, an explanation for the discrepancy is determined, or further investigation is performed to confirm the found value. If an impurity is not found on either instrument, the detection limit for the more sensitive instrument will be reported on the CoA with a “<” symbol to indicate the value was not found. The instrument from which the TMI detection limits and found values are reported is indicated by either an “M” for ICP-MS or an “O” for ICP-OES. See Figure 5 for an example of the TMI report which can be found in Section 5.0 of the CoA for our stock 1,000 ppm Calcium (Ca) product, CGCA1.

Figure 5. Example of TMI data reported in CoAs of single-element stock Certified Reference Materials (CRMs) supplied by Inorganic Ventures.
Performing two separate analyses, on different instruments, using different sample preparation techniques, standards, and analytical methods provide us with greater confidence in our results when both methods yield the same found impurity values. This combination of methods also allows us to avoid interferences that may be unavoidable for certain impurities on one instrument versus the other. We are also able to achieve optimal detection limits since some elements will have better detection limits on ICP-OES while others will be better on ICP-MS. After the first chemist completes the data workup for a TMI analysis, a second chemist will review all of the data from both instruments to ensure that the final TMI values are correct.
Let our high purity standards with thorough, detailed, and reliable TMI information give you greater confidence in your results and peace of mind for your analysis!